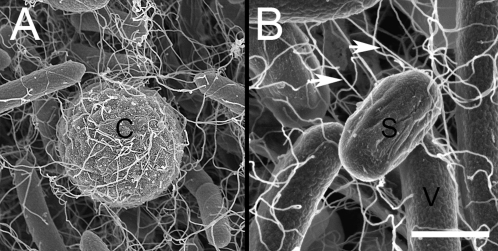
Fig. 4.
Imaging of transport by scanning EM. (A) Conidium of A. fumigatus during transport by a P. vortex swarm imaged 3 h after inoculation at a location 24 cm from the inoculation point. C indicates the conidium. (B) Same as A but showing transport of a spore of P. vortex imaged 2 h after inoculation 2 cm away from the site of loading. Spore is marked by S. V indicates part of a P. vortex bacterium. Arrows indicate flagella. (Scale bar: A, 3 μm; B, 1 μm.)

