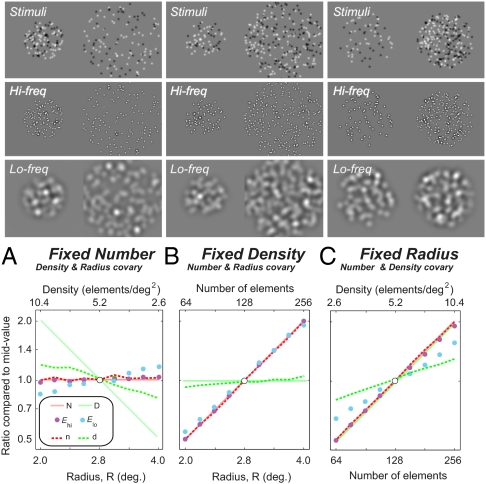
Fig. 5.
Stimuli with one parameter fixed—(A) number, (B) density, or (C) radius—and the other two allowed to covary. (Upper, row 1) Example stimuli and (Upper, row 2) high-SF and (Upper, row 3) low-SF filtered versions of rectified versions of the stimuli. (Lower) Graphs plot pooled energy from the high (purple circles) and low (blue circles) filters under conditions of fixed number, density, and radius, along with the estimated density (green dashed lines) and number (red dashed lines) based on response ratio. Units are a proportion relative to the value derived from the midvalue stimulus (so all lines pass through 1.0). An ideal estimate of number and density is shown as the solid red and green lines, respectively.

