Fig. 1.
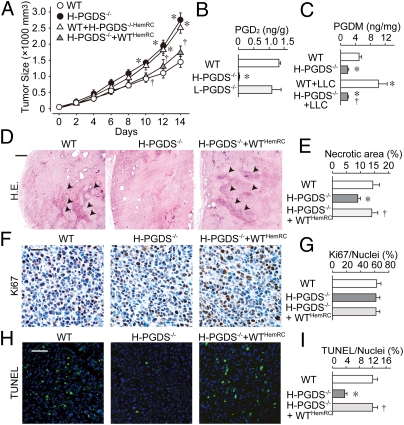
(A) Tumors on H-PGDS−/− mice have increased growth rates (n = 25 each; *†P < 0.05 compared with WT or H-PGDS−/−). (B and C) Detection of PGD2 in implanted tumors and tetranor-PGDM in urine. The results were normalized to the weight of the tumor mass (B, n = 4 each) or normalized to creatinine content (C, n = 4–5; *†P < 0.05 compared with WT or WT+LLC). (D–I) Host H-PGDS deficiency decreases necrotic/apoptotic regions in tumors: H&E staining (D), Ki67 staining (F), or TUNEL (H). Ki67 staining (brown) was counterstained with hematoxylin (blue). (Scale bars: D, 200 μm; F, 10 μm; H, 50 μm.) TUNEL was counterstained with DAPI (blue) for nuclear labeling. Necrotic areas were quantified relative to total pixel density (E). The numbers of Ki67-positive or TUNEL-positive cells were normalized to total nuclei number (G and I, n = 6 each; *†P < 0.05 compared with WT or H-PGDS−/−).

