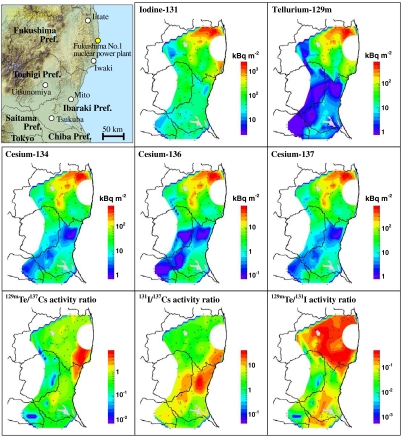
Fig. 1.
Topographic map of the surveyed area including Fukushima and its adjacent prefectures; contour maps of depositions for 131I, 129 mTe, and 134,136,137Cs; and activity ratios for 129mTe/137Cs, 131I/137Cs, and 129mTe/131I. Activities on March 29, 2011 are shown. Open circle indicates position of sampling point.

