Fig. 3.
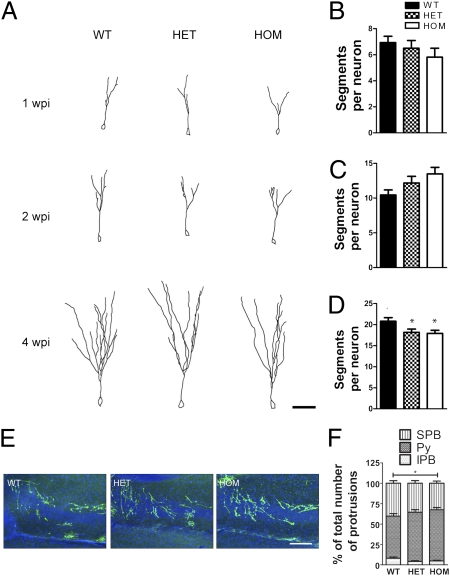
Analysis of adult-born neurons. (A) Representative tracings of adult-born neurons at 1, 2, and 4 wpi and (B–D) quantification of the number of dendritic segments per neuron at 1 (B; P = 0.4; n = 14, 18, and 16 cells), 2 (C; P = 0.319; n = 20, 23, and 19 cells), and 4 wpi (D; P = 0.02; n = 20, 19, and 22 cells). (E and F) Axonal distribution in the proximal CA3 (E). (F) More axons (in percentages) are found in the Py of HOM mice at the expense of axons located in the IPB (P < 0.05). The difference to the SPB was not significant (n = 6, 6, and 4 mice). Values represent mean ± SEM. *P < 0.05. (Scale bars: A, 50 μm; E, 100 μm.)

