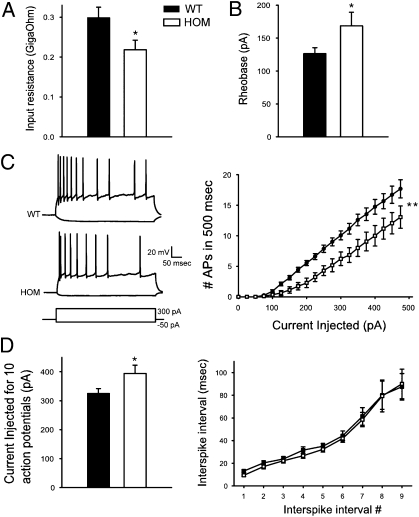
Fig. 5.
Whole-cell recordings from GCs. (A) Input resistance of HOM GCs was 26.8% lower than input resistance of WT GCs (P = 0.004; n = 15 and 17 cells, respectively). (B) The amount of current required to evoke a single action potential (rheobase, 100-ms square-wave pulse) was 33.5% greater in HOM neurons (P = 0.04; n = 6 and 14 cells). (C Left) Example current-clamp recordings from WT and HOM GCs in response to hyperpolarizing (−50 pA) and depolarizing (+300 pA) current injections. (C Right) The number of action potentials evoked by 500-ms square-wave current injections (at +25-pA increments) from resting potential was lower in HOM neurons over the full range of stimulation. (D Left) Current injected to evoke 10 action potentials (as analyzed in D Left) was higher in HOM neurons (n = 9 and 14 cells). (D Right) Adaptation during trains of 10 action potentials was not significantly different between genotypes. Values represent mean ± SEM. *P < 0.05; **P < 0.005.

