Fig. 6.
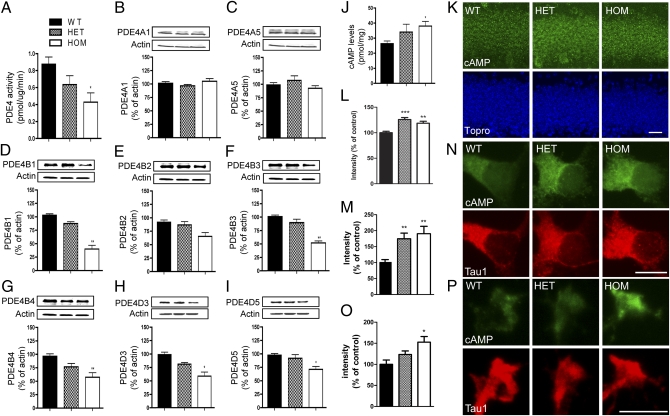
Analysis of PDE4 and cAMP levels. (A) Decreased PDE4 activity in HOM mice (in picomoles per microgram per minute; P < 0.05; n = 4 mice/genotype). (B–I) Analysis of PDE4 isoform protein levels in the HPC of Disc1Tm1Kara mice showing normal levels of PDE4A splice variants (B and C), decreased PDE4B variants (D–G; P < 0.005), and decreased PDE4D variants (H and I; P < 0.05; expressed as percentages of WT; n = 4 mice/genotype). (J–L) Increased cAMP levels in HPC lysates (J; P < 0.05; n = 5 mice/genotype) and increased cAMP immunoreactivity (as percentages of WT) in the GC layer of Disc1Tm1Kara mice (K and L; P < 0.005). The GC layer is counterstained with the nuclear stain Topro (blue; n = 5, 6, and 7 mice). (M–P) Analysis of cAMP levels in hippocampal neurons. Quantification of cAMP immunoreactivity (as percentages of WT) in the cell soma (M and N; P = 0.002; n = 60, 66, and 60 cells) and (O and P) axonal growth cones (P = 0.01; n = 50, 120, and 60 growth cones). Cell bodies and growth cones are counterstained with Tau1. Values represent mean ± SEM. *P < 0.05; **P < 0.005; ***P < 0.0005. (Scale bars: K, 25 μm; N and P, 10 μm.)

