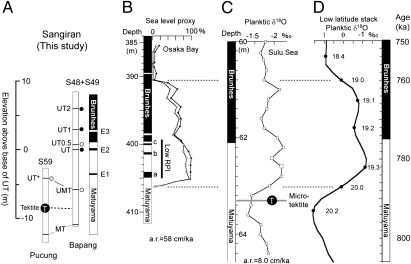
Fig. 2.
Correlation of the magnetic polarity stratigraphy records across the MB transition. (A) The magnetic polarity stratigraphy from the Sangiran area. UT* in the columnar section at S59 was previously correlated with UT at the Bapang-type sections (S48+S49), but is now correlative with UMT at S48 (see text). Solid/open circles show normal/reverse magnetic polarity. (B) The magnetic polarity and diatom-based sea-level proxy from the Osaka Bay 1,700-m core (28). The bar shows the low relative paleointensity (RPI) zone. The sea-level proxy curve with solid circles represents the values of 100 minus the percentage of freshwater diatoms, and that with open circles represents the percentages of marine and brackish water diatoms. (C) The magnetic polarity and planktic δ18O from the Sulu Sea (ODP site 769) after Schneider et al. (29). The magnetic polarity boundary is shifted upward by 15 cm because of the effect of delayed lock-in (30). (D) Low-latitude stack of planktic δ18O and magnetic polarity stratigraphy after Bassinot et al. (31).

