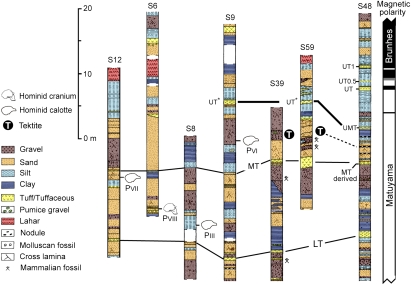
Fig. 3.
Lithostratigraphy of the Bapang Formation sections, showing the stratigraphic level of the two in situ tektites and some of the H. erectus cranial remains. The transitional zone in the magnetic polarity stratigraphy is shown in gray. UT* in the columnar sections (S9, S59) was previously correlated with UT (21) but is now correlative with UMT (see text).

