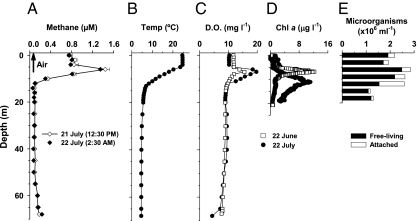
Fig. 1.
Depth profiles for Lake Stechlin. (A) Mean methane concentrations during day and night (July 21 and 22, 2010, respectively). Error bars during the day are SDs of two to three measurements of the same bottles. Arrow indicates methane concentration in the air. (B) Average temperature on July 21 and 22. (C) Dissolved oxygen (DO) on June 22 and July 22. (D) Chlorophyll (Chl) a concentrations on June 22 and July 22. (E) Free-living and attached microorganism abundances on July 22.

