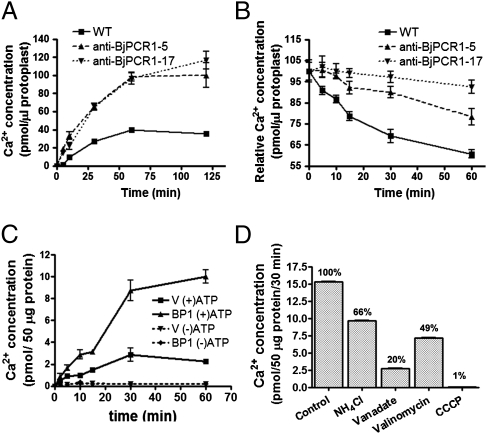
Fig. 5.
Ca2+ transport mediated by BjPCR1. (A) Time-dependent Ca2+ uptake by protoplasts of WT and anti–BjPCR1-5 and anti–BjPCR1-17. The protoplasts were suspended in loading buffer containing 100 μM CaCl2, 18.5 kBq of 45CaCl2, and 18.5 kBq of 3H2O, and they were then incubated for the indicated periods of time. Only the intact protoplasts were collected by centrifugation. (B) Time-dependent release of Ca2+ from protoplasts of WT and anti-BjPCR1 plants. The protoplasts were preloaded in medium containing 100 μM CaCl2 and 18.5 kBq of 45CaCl2 for 30 min, washed briefly with ice-cold bathing solution, and incubated in the bathing medium. Only intact cells were collected, and radioactive disintegrations from the samples were counted. The Ca2+ content was normalized against the 3H2O content of the protoplasts. The average ± SE is shown (n = 4, N = 3). (C and D) Ca2+ uptake experiment in yeast microsomes isolated from Saccharomyces cerevisiae transformed with the empty vector (V) or BjPCR1 (BP1). (C) Time course of Ca2+ uptake by vesicles from cells transformed with V or BP1. Ca2+ uptake was performed in the absence (−ATP) or presence (+ATP) of 4 mM Mg-ATP in Ca transport medium containing a standard transport buffer at 25 °C for the indicated period. The microsomes were collected by filtration on a nitrocellulose filter. (D) Effects of inhibitors of ion transport on Ca2+ uptake by vesicles derived from BP1-expressing cells. Uptake assay was performed using yeast microsomes expressing V or BP1 in the Ca2+ transport medium containing 4 mM Mg-ATP (Control) plus the compounds indicated [i.e., NH4Cl, 5 mM; vanadate, 1 mM; valinomycin, 2 μM; carbonyl cyanide m-chlorophenylhydrate (CCCP), 10 μM]. The bars represent the Ca2+ concentrations in vesicles expressing BjPCR1 minus those in vesicles transformed with empty vector (n = 4, N = 2). The values (%) in the graph are the rates of uptake expressed as a percentage of the control. Average values ± SE are shown (n = 3, N = 2).

