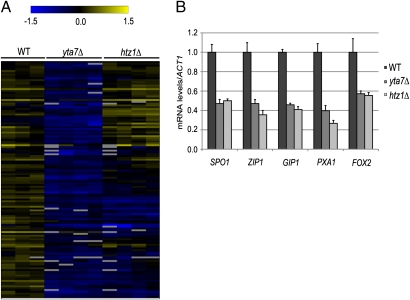
Fig. 1.
Significant coregulation by Yta7 and H2A.Z. (A) Hierarchical clustering analysis of genes significantly down-regulated in the yta7Δ mutant indicated that the majority were also down-regulated in cells lacking H2A.Z (htz1Δ). Both genes and samples were clustered according to complete linkage, with the distance metric of the Pearson correlation. Values are log2 (strain/pooled reference), where each column is a biological replicate. Gray rectangles indicate missing data values for that experiment. (B) RNA analysis of inducible genes in non-inducing conditions. The level of each transcript was normalized to ACT1 mRNA levels and adjusted to a WT level set equal to 1. In this and all other figures, the error bars represent the SEM of at least three biological replicates.

