Fig. 3.
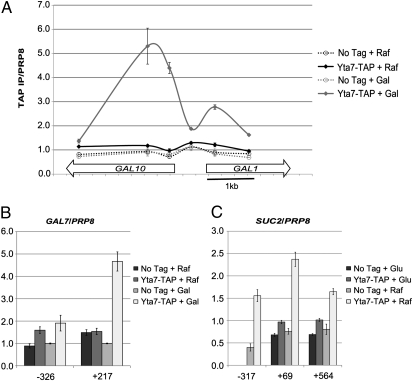
Yta7 localized to inducible genes upon activation. (A) ChIP analysis of Yta7-TAP across GAL10-GAL1 in inducing and non-inducing conditions. The two conditions represent YPRaffinose (Raf; 2%, non-inducing) and the same cultures 1 h after addition of galactose (+ Gal). Values were obtained with qPCR and represent the IP signal over the IP signal for the negative internal control PRP8. (B) ChIP analysis of Yta7-TAP, as above, at GAL7. Numbering in this and subsequent figures refers to base pairs from the start of the ORF for the gene indicated. (C) Yta7-TAP enrichment at SUC2 in YPD (2%) vs. Raf (2%), in which SUC2 is induced.

