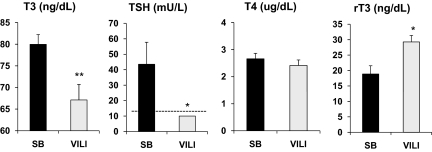
Fig. 1.
Serum TH and TSH levels in WT mice after VILI. Serum T3, TSH, T4, and rT3 concentrations in WT mice exposed to VILI (gray bars) compared with SB animals (black bars). Note that TSH levels were undetectable after VILI and were assigned a value equal to the sensitivity of the assay (10 mU/L, indicated by a dashed line) for statistical analysis. Values shown are mean ± SEM. Differences between groups are indicated: *P < 0.05; **P < 0.01. n = 8 animals per group.

