Fig. 2.
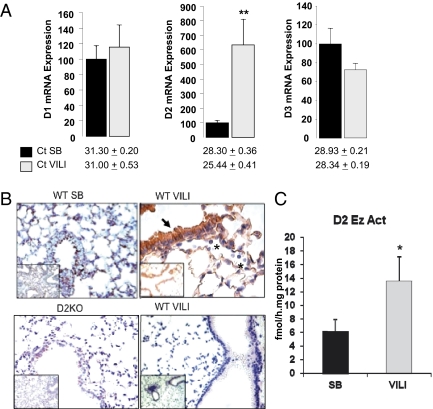
D1, D2, and D3 mRNA levels and D2 protein levels and enzymatic activity in the lungs of WT animals exposed to VILI. (A) Lung D1, D2, and D3 mRNA levels in WT mice after VILI (gray bars) compared with SB animals (black bars). Values shown are mean ± SEM. Significant differences between groups are indicated: *P < 0.05; **P < 0.01. n = 8 animals per group. The number of cycles in the quantitative PCR (Ct) is given below the bars to indicate the relative abundance of each enzyme. (B) (Upper Left) Immunohistochemical staining of D2 (brown) is shown for an SB WT mouse in which D2 protein was graded as 1+ in the epithelium and 1+ in pulmonary endothelium. Minimal inflammatory cells were observed. (Upper Right) Sections from a WT mouse exposed to VILI demonstrate 3+ D2 in the epithelium and 3+ in pulmonary endothelium. More inflammatory cells were observed, but no immunoreactivity was observed in these cells (indicated by asterisk). (Lower Left) Staining of D2 in a section from a D2KO mouse. The absence of D2 staining shows the specificity of the antibody. (Lower Right) Negligible D2 staining of a WT mice after VILI by using the preimmune serum (n = 2 animals per group). Inset shows a lower magnification a representative area of lung. (C) D2 enzymatic activity after VILI (gray bar) compared with SB animals (black bar). Values shown are mean ± SEM. Significant differences between groups are indicated: *P < 0.05. n = 8 animals per group.

