Fig. 6.
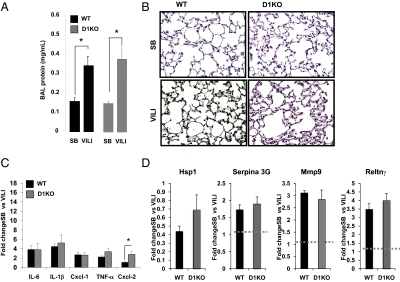
Response to VILI is comparable in D1KO and WT mice. (A) BAL protein content in WT and D1KO mice exposed to VILI compared with SB animals. Differences between groups are indicated. *P < 0.05. (B) H&E staining of a lung section of a WT mouse and a D1KO mouse SB and after exposure to VILI. Histology of VILI-exposed WT and D1KO mice shows higher polymorphonuclear cell infiltration and hyaline membrane formation with no differences between the two groups (n = 3 animals per group). (C) Fold changes of VILI biomarker genes (IL-6, IL-1β, Cxcl1, TNF-α, and Cxcl2) by qPCR in WT and D1KO mice exposed to VILI relative to SB animals as control. *P < 0.05 vs. WT mice. (D) Fold change of Hsp1, Serpina 3G, Mmp9, and Retlnγ by qPCR in WT (n = 8) and D1KO (n = 6) (gray bars) mice exposed to VILI relative to SB animals as control.

