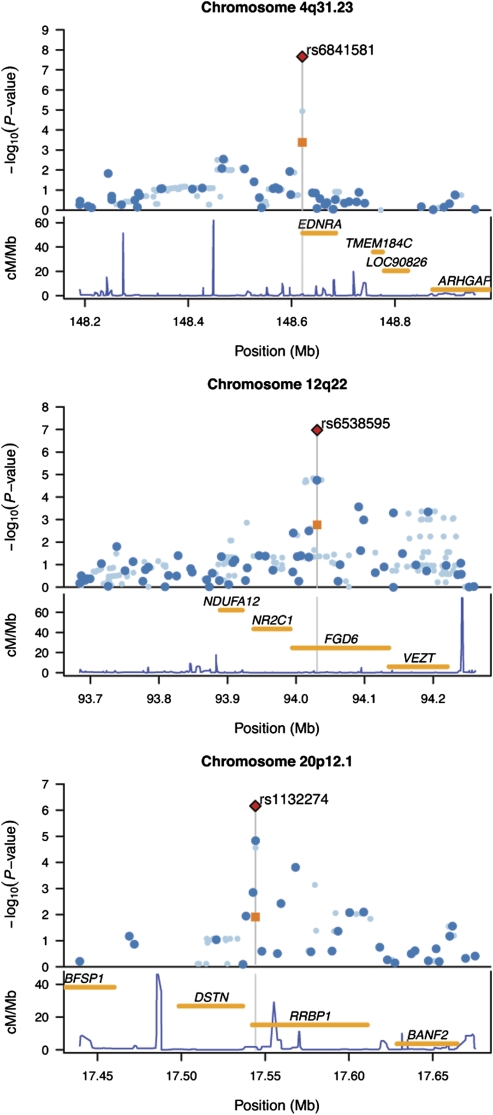
Fig. 2.
Regional plots for associated regions. For each chromosomal interval, −log10 P values for association test are plotted against the genomic coordinates (NCBI build 36) (Upper); the recombination rates obtained from the HapMap database and the RefSeq genes (hg18) within the regions (Lower). The rs identifier of the SNP listed in Table 2 is shown for each chromosomal interval, and its position is indicated by the gray vertical line (Upper). Dark and light blue dots represent results of the genotyped and imputed SNPs for the discovery cohort, respectively. Orange squares represent the association result from the replication cohort using the JP1 plus JP2 (rs6541581 and rs6538595) or JP2-only (rs1132274); combined P values of the discovery and replication cohorts based on the fixed-effects model are shown by red diamonds.

