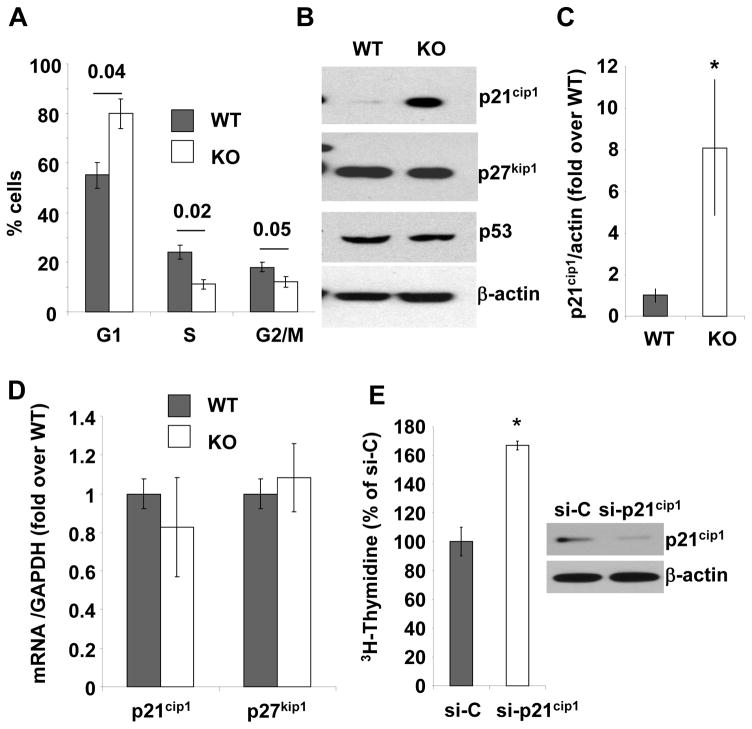
Figure 3. Effect of EBP50 on vascular smooth muscle cell cycle and p21cip1 expression.
A. Cell cycle distribution analyzed by FACS in WT (gray bars) and KO (white bars) VSMC. The percentage ± standard error of the population of cells in G1, S and G2/M phases are derived from five independent experiments. P values for WT vs. KO are indicated. B. Immunoblots for p21cip1, p27kip1 and p53 in WT and KO VSMC. β-actin was used as loading control. Blots are representative of at least five independent experiments. C. Quantification of the expression of p21cip1 in WT (gray bars) and KO (white bars) VSMC. The ratio of p21cip1 expression over β-actin was determined in five independent experiments. *, p<0.04. D.Quantitative RT-PCR for p21cip1 and p27kip1 using mRNA from WT (gray bar) and KO (white bar) VSMC. Results are presented as fold over WT ± standard error of triplicate determinations. Values were normalized relative to GAPDH. E. Inhibition of p21cip1 expression by siRNA increases VSMC proliferation. Immunoblot for p21cip1 in KO VSMC transfected with either control siRNA (si-C) or p21cip1siRNA (si-p21cip1) as indicated. β-actin is used as loading control. Proliferation of KO VSMC transfectedwith either control siRNA (si-C) or p21cip1 siRNA (si-p21cip1) and maintained in 10% FBS determined by [3H]-thymidine incorporation. Data are presented as percentage of si-C treated cells ± standard error of triplicate determinations. Similar results were obtained in two additional experiments. *, p<0.003.

