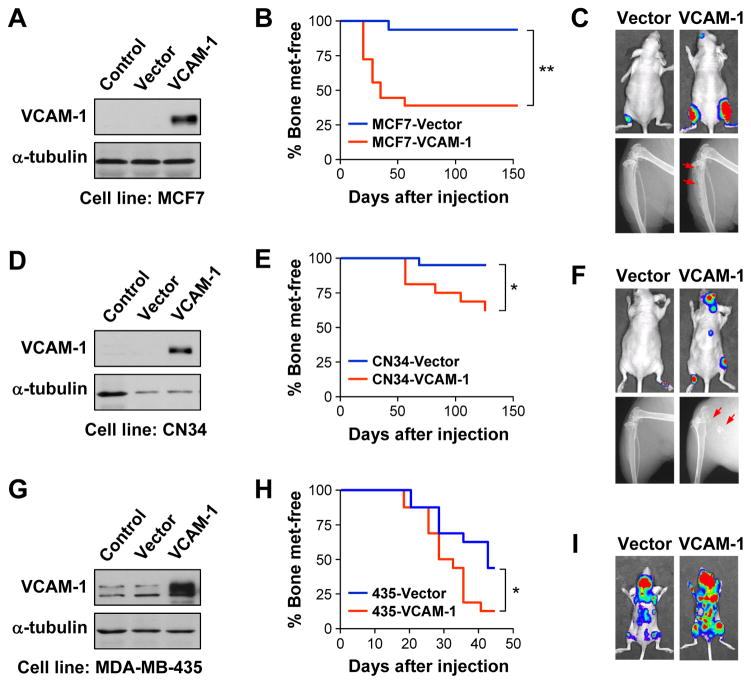
Figure 3. Pro-metastatic activity of VCAM-1 in additional bone metastasis models.
(A) Ectopic overexpression of VCAM-1 in MCF7 as detected by western blot. (B) Kaplan-Meier curve of bone metastasis development of control and overexpression MCF7 cells. N=10. **p < 0.01 by log-rank test. (C) Representative BLI (Day 125) and X-radiographs (Day 154) of mice from (B). Arrows point to osteolytic lesions. (D) Ectopic overexpression of VCAM-1 in CN34 as detected by western blot. (E) Kaplan-Meier curve of bone metastasis development of control and VCAM-1 overexpressing CN34 cells. N=10. *p < 0.05 by log-rank test. (F) Representative BLI (Day 125) and X-radiographs (Day 154) of mice from (E). Arrows point to osteolytic lesions. (G) Ectopic overexpression of VCAM-1 in MDA-MB-435 as detected by western blot. (H) Kaplan-Meier curve of bone metastasis development of control and VCAM-1-overexpressing MDA-MB-435 cells. N=10. *p < 0.05 by log-rank test. (I) Representative BLI (Day 42) of mice from (H).

