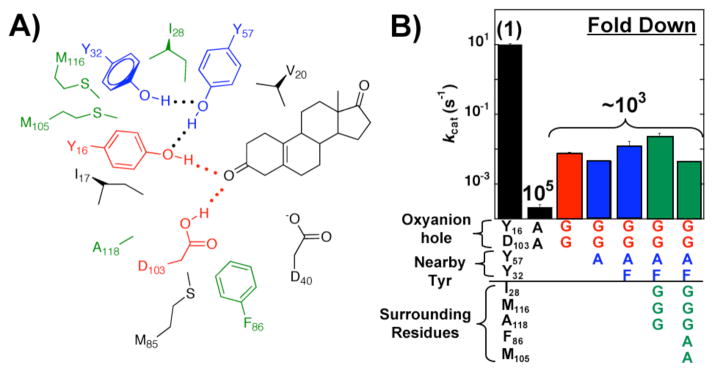
Figure 2.
‘Carving out’ the pKSI oxyanion hole. A) Schematic representation of oxyanion hole hydrogen bond donors (red), tyro-sine network (blue), and surrounding residues (green and black). The substrate is also shown in black. B) Rate effects from ablating neighboring side chains in the oxyanion hole mutant background. Values are from Table S1. Bars and residues are colored according to panel A.

