Figure 3.
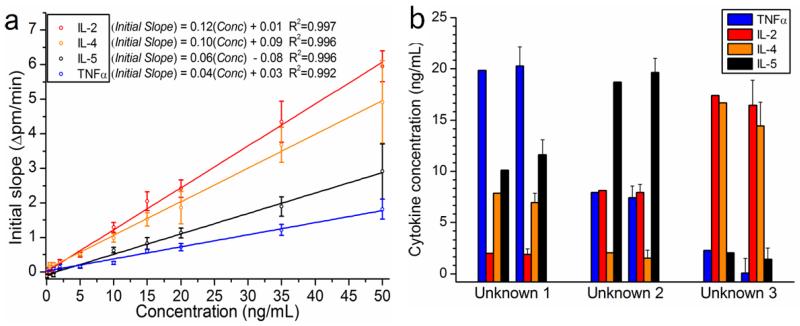
Simultaneous quantitation of 4 cytokines from 3 blinded unknowns prepared in serum-containing cell media. (a) The average control ring-corrected initial slope is plotted as a function of cytokine concentration for each cytokine. All multiplexed standards were prepared in cell culture media containing 10% serum, and all calibration data was obtained on a single chip that was also used for determination of unknowns. The calibration curves used 10 standards between 0 and 50 ng mL−1. Each calibration curve is fit well with a linear regression (all R2≥0.992), and the displayed equations are used to quantitate solutions with unknown cytokine concentrations via inverse regression. (b) Cytokine cocktails of unknown concentration were prepared in RPMI 1640 + 10% FBS. After incubating with all 4 corresponding detection antibodies, the unknowns were quantitated by measuring the initial slope of the binding interaction in a one-step sandwich immunoassay. For each blinded unknown, the as-prepared values (left) show strong agreement with the values determined by the ring resonator array (right). Error bars represent the total propagated standard error that includes: (1) the standard deviation of n=4-5 rings used to analyze each cytokine and (2) the regression error of the calibration curve.

