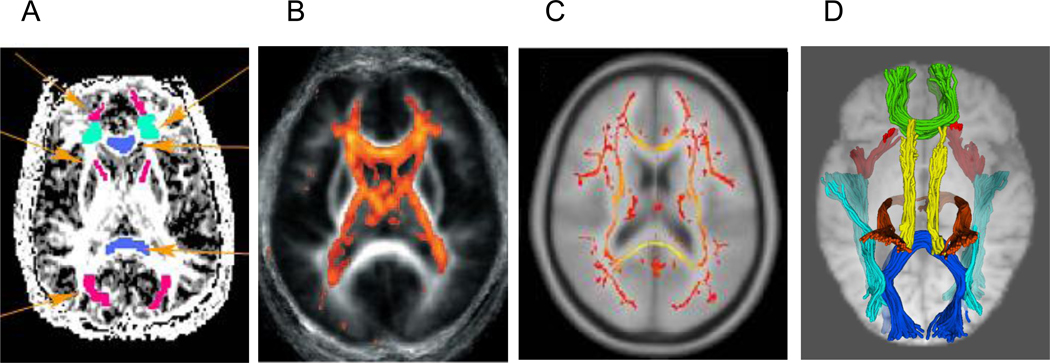
Figure 1.
Methods for representing diffusion tensor imaging (DTI) data. A = regions of interest (in color) placed directly on DTI image; B = voxel-based morphometry (VBM); C = mean “skeleton” of white matter tracts from tract-based spatial statistics (TBSS); D = fiber tracking of white matter pathways. Image courtesy of Simon Davis, University of Cambridge.

