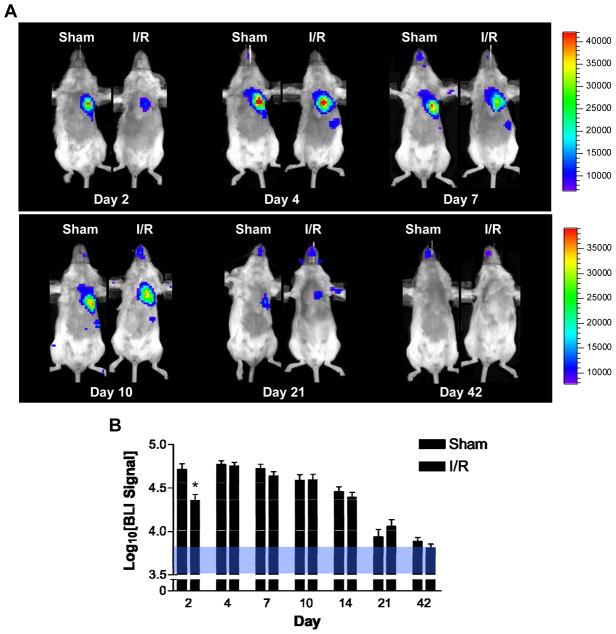
Figure 3. Longitudinal bioluminescent imaging analysis of BMMC transplantation into normal and ischemic hearts reveals differential early survival patterns.
(A) Images following the same two animals (sham on left and ischemia-reperfusion [I/R] on the right) demonstrate significantly lower number of cells on day 2 in ischemic hearts. Ischemia also induced a proliferation response resulting in a rapid rise in BLI signal between days 2 and 4 in the I/R group (scales represent BLI signal in p/s/cm2/sr). Longitudinal cell survival was similar in both groups, reaching background levels by day 42. Average BLI signal from both sham (n=8) and I/R (n=8) groups are summarized in (B). Background signal range is given by the area shaded blue. Error bars represent SEM, *P < 0.05.

