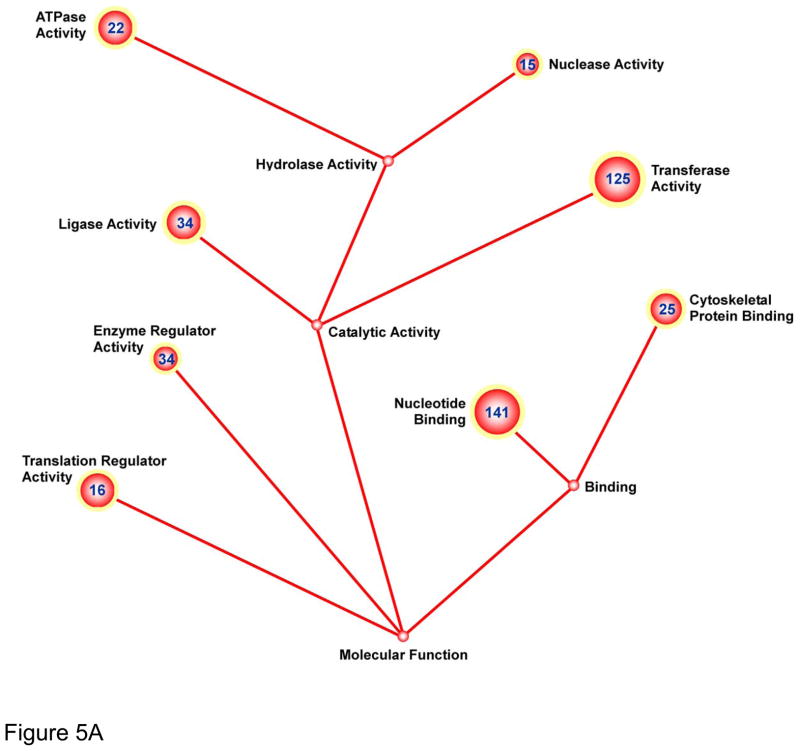
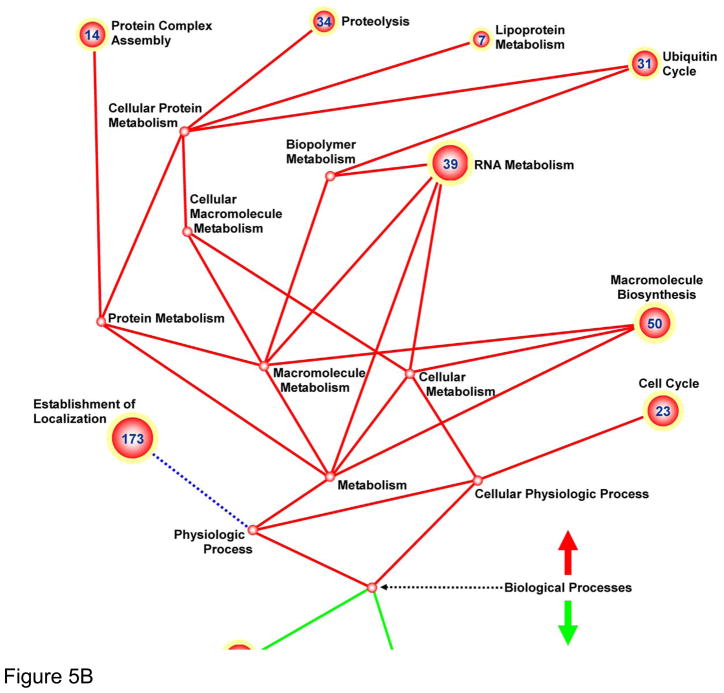
Figure 5. Genomic profiling of BMMCs transplanted into ischemic myocardium reveals down-regulation of differentiation and cell fate commitment pathways.
Ball-and-stick figures represent ontological cluster function analysis of gene expression changes. Enumerated spheres represent significantly up- or down-regulated groups of genes (GO-terms). Size of spheres correlates to the significance of enrichment of the GO term (sphere radius is proportional to −log10[p-value for GO-term]) and numbers within sphere designate number of genes within the GO-term significantly up or down-regulated. Solid lines represent parent-daughter relationship between terms; terms related otherwise are connected by dashed lines. Functional groups were further sub-sorted into Molecular Function (A) and Biological Processes (B).


