Figure 2.
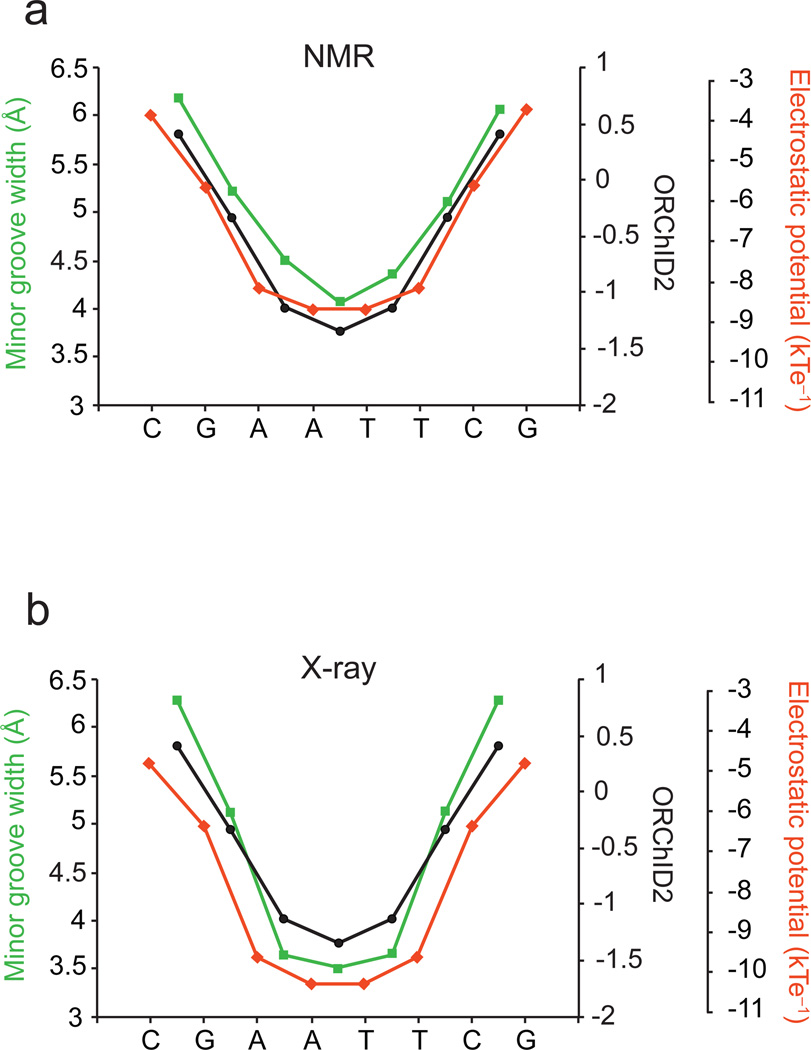
(a) Quantitative correlation of the experimental ORChID2 cleavage pattern (black circles), with electrostatic potential (red diamonds) and minor groove width (green squares) determined from a set of five NMR structures of the Drew-Dickerson dodecamer. The Pearson correlation for comparison of the ORChID2 pattern with minor groove width (7 nucleotide positions) is 0.9917 (p-value = 1.21 × 10⁻⁵); for comparison of ORChID2 with electrostatic potential (7 positions), 0.868 (p-value = 0.01). (b) Quantitative correlation of the experimental ORChID2 cleavage pattern (black circles), with electrostatic potential (red diamonds) and minor groove width (green squares) determined from eight X-ray structures of the Drew-Dickerson dodecamer. Minor groove width and electrostatic potential are symmetrized to reflect the symmetry of the Drew-Dickerson sequence. The Pearson correlation for comparison of the ORChID2 pattern with minor groove width (7 positions) is 0.997 (p-value = 7.27 × 10⁻⁷); for comparison of ORChID2 with electrostatic potential (7 positions), 0.881 (p-value = 8.67 × 10⁻³).

