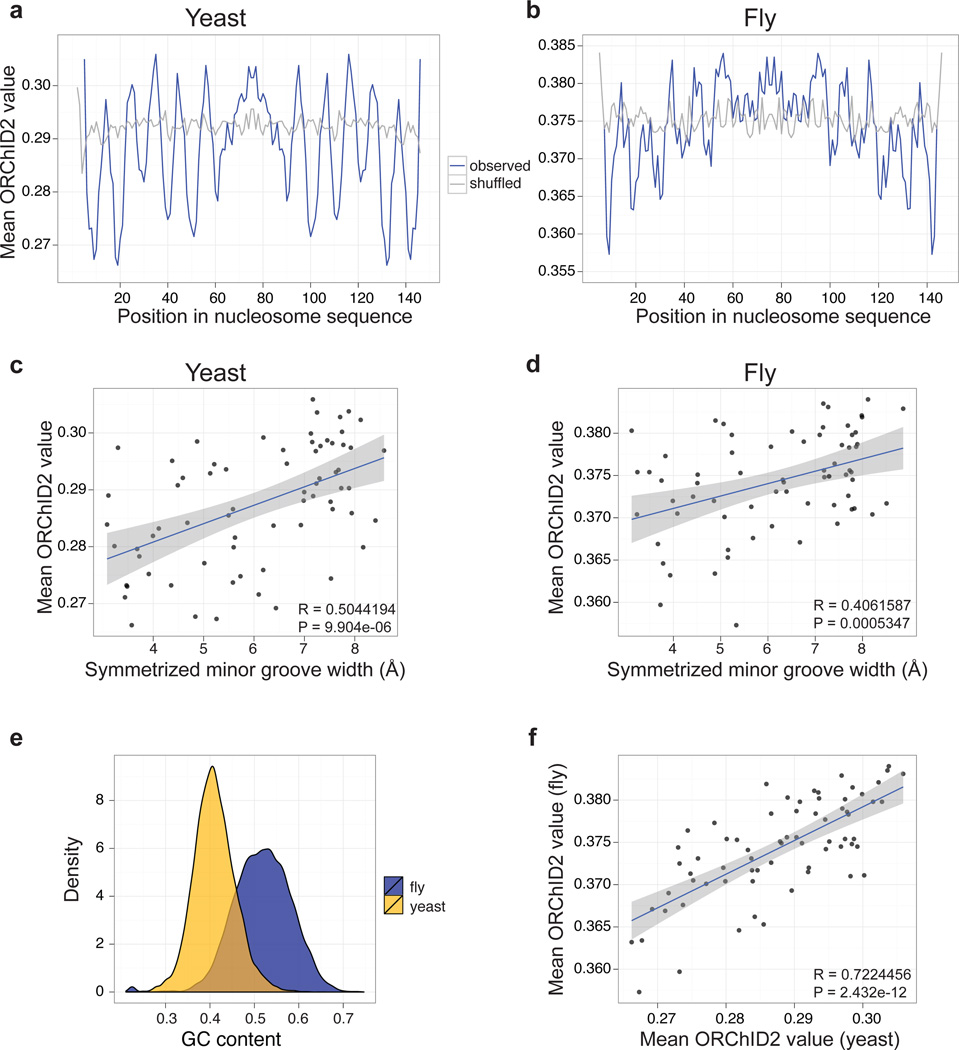
Figure 3.
ORChID2 nucleosome patterns in yeast and fly. Mean ORChID2 values at each nucleotide position of 23,076 yeast (a) and 25,654 fly (b) nucleosome sequences (blue lines) are compared with ORChID2 values for shuffled versions of the same sequences (gray). Minor groove width measurements from nucleosome X-ray structures 1KX5 and 2PYO (Supplementary Figure 4) were aligned by dyad center to the ORChID2 patterns from panels a and b, respectively, and plotted for yeast (c) and fly (d). There is a significant correlation of the ORChID2 value with minor groove width for both yeast and fly nucleosome-bound sequences (inset, panels c and d). (e) Yeast and fly nucleosome sequences have significantly different G/C content distributions (P < 2.2 × 10⁻¹⁶; Wilcoxon rank sum test), but their overall ORChID2 patterns are highly correlated (f). All correlation plots (panels c, d, f) are based on one-half of the nucleosome dyad and are center-aligned by the dyad axis. Gray shading indicates the standard error around the best-fit line.

