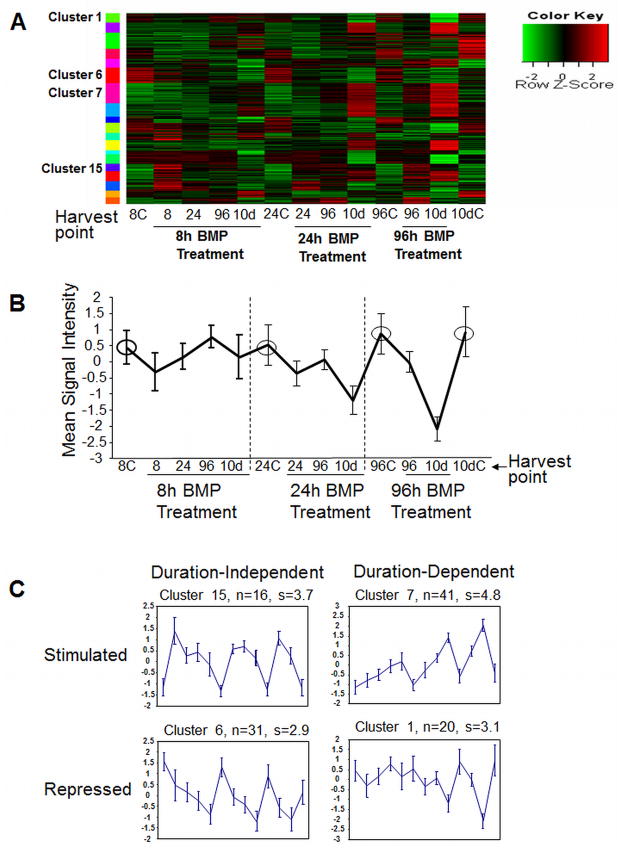
Figure 1. BMP6 regulates a two-wave transcriptional process during osteoblast differentiation.
Expression results were clustered using the model based clustering algorithm MCLUST across all time points and treatment conditions. (A) Heat map of the most significant clusters. (B) Reference Clustering Plot (in this case cluster 1). Circled points are the control conditions where the expression level is essentially constant. (C) Representative profiles of the four most common cluster patterns with BMP6 treatment. In some cases BMP6 treatment induces expression (clusters 15 and 7) or represses expression (clusters 6 and 1). For some profiles, removal of BMP6 treatment results in expression reverting back to the control levels (e.g. clusters 15 and 1) (treatment duration dependent), while in other cases a transient exposure of BMP6 is sufficient to activate a pathway that remains changed even after short-term BMP6 exposure and BMP6 removal (e.g. clusters 7 and 6) (duration independent). Refer to Supplementary Figure 1 to view all 19 clusters and Supplementary Tables 1–5 for specific genes located in these clusters. Differentially expressed genes in clustered groups were validated using quantitative real-time PCR in 2–3 independent donor hMSC lines.

