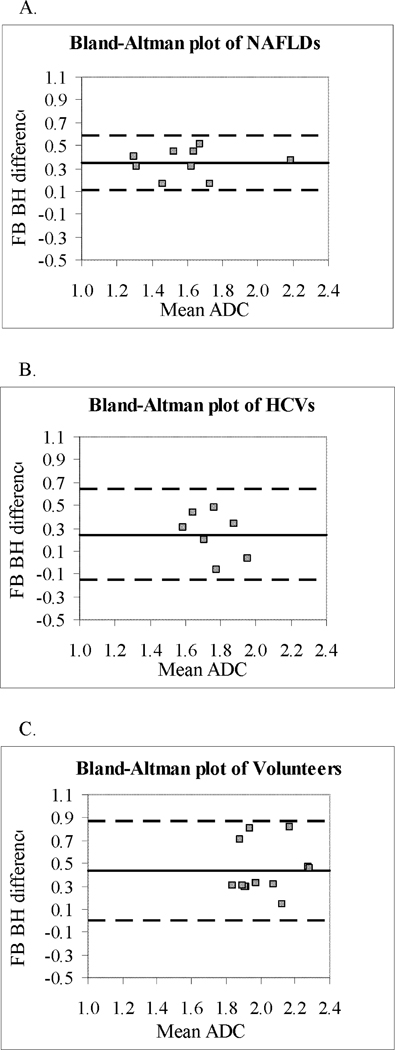
Figure 4.
Bland-Altman plots of average liver ADC in (A) patients with NAFLD, (B) patients with HCV, and (C) healthy volunteers. The difference between the ADC with 2 breathing techniques (BH and FB) is plotted against the average of the ADC measurements made by the 2 breathing techniques. The central line represents the mean absolute difference between the two techniques, and the dashed lines represent the 95% limits of agreement. There is reduced scatter in NAFLD patients compared to healthy volunteers and compared to patients with HCV (not significant). ADC values on X and Y axis are (×10−3 mm2/sec).

