
Figure 3.
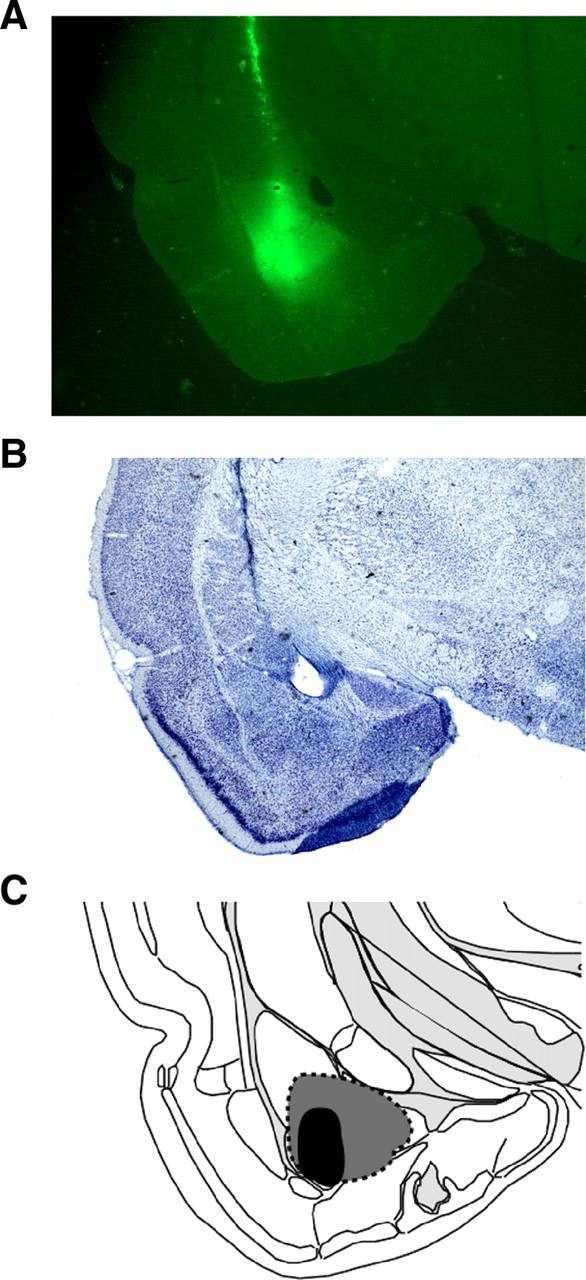
Illustrations of the CTb injection site and CTb spread within the BA. A, A representative CTb-stained coronal section displaying the site of the CTb injection. B, Adjacent thionin sections were used to ensure that CTb spread did not extend beyond the boundaries of the BA. C, Schematic of CTb spread; gray indicates rats with maximal CTb spread, and black represents rats with the smallest injections of CTb. Images were adapted from Swanson (2004).