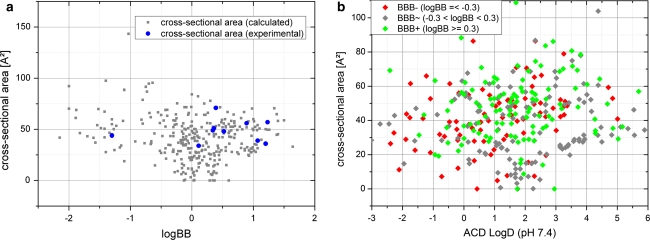
Fig. 4.
a Experimental logBB plotted against 11 experimental and 362 calculated CSA show no correlation. Blue dots represent experimental CSA values, whereas grey dots are based on calculated CSA values. b Colour coded scatterplot of CSA versus LogD (at pH = 7.4), where green dots represent BBB permeable, red dots represent non-BBB permeable and gray dots represent unclassified compounds

