
Figure 5.
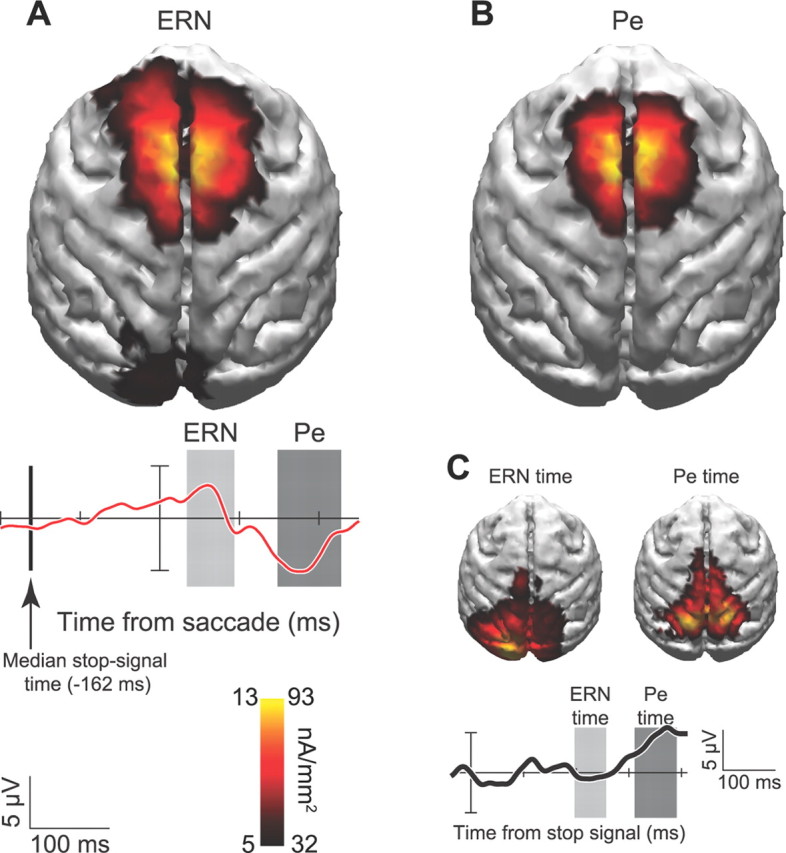
A–C, Current density distribution for ERN (A), Pe (B), and visual response to stop signal (C). Current density estimates are projected onto MRI reconstruction from the same monkey. Warmer colors indicate greater density of current flow according to the scale for the ERN on the left side of the key and the Pe on the right side of the key. Error minus correct difference wave (red) and response to stop signal on correct canceled trials (black) are shown with temporal windows measured for each component. Vertical line shows median stop signal presentation time relative to saccade initiation.