
Figure 8.
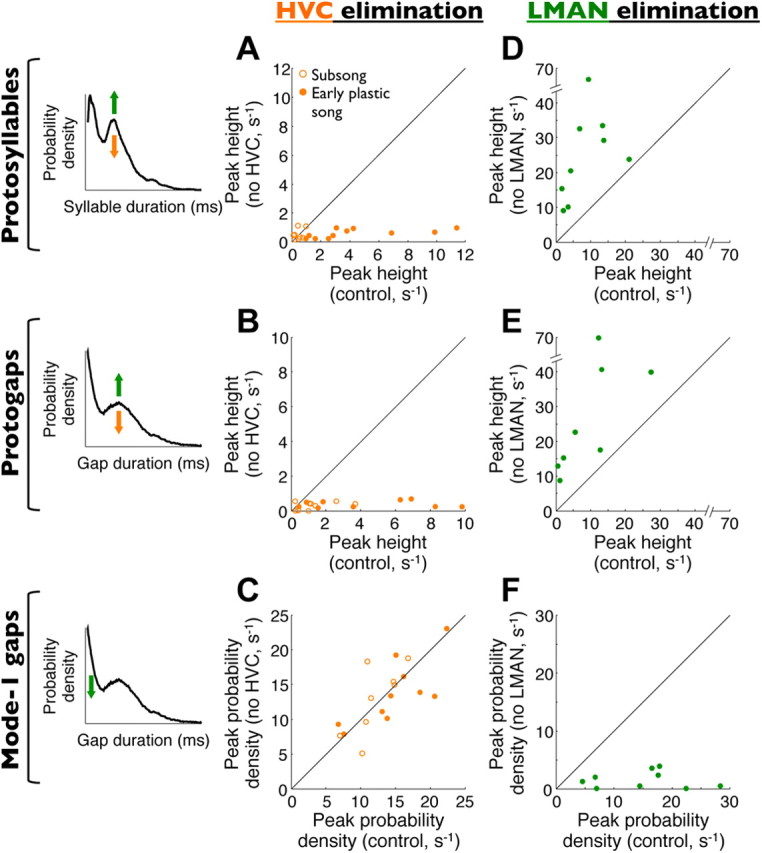
Summary of bilateral HVC and LMAN elimination experiments across birds. Note that only HVC eliminations are shown for subsong birds because these do not sing after LMAN inactivations (Aronov et al., 2008). Left column, Schematic illustrations of the effects of HVC elimination (orange arrows) and LMAN elimination (green arrows) on syllable and gap distributions. A, Scatter plot of the size of the peak in syllable durations (protosyllables) before and after HVC elimination. B, Size of the peak in gap durations (protogaps) before and after HVC elimination, calculated as the magnitude of the components corresponding to mode-2 gaps. C, Fraction of mode-1 (expiratory) gaps before and after HVC elimination. D–F, Effects of LMAN elimination on the same quantities as those shown in A–C.