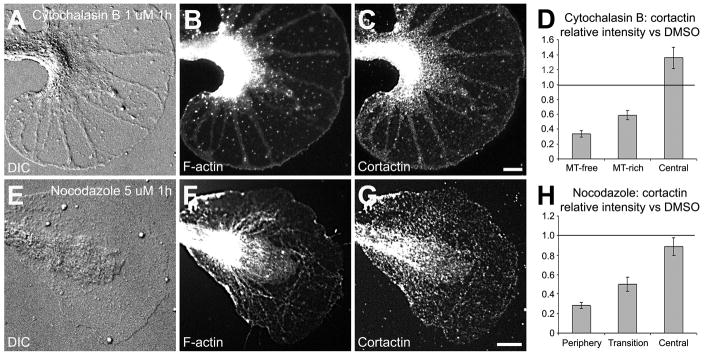
Figure 3. Cortactin redistributes with F-actin after cytoskeletal perturbation.
Bag cell cultures were treated with 1 μM cytochalasin B (A–D) or 5 μM nocodazole (EH) for 1h. After fixation, cells were co-stained for F-actin (B and F) and cortactin (C and G). DIC pictures (A and E) show the morphological changes occurring after cytoskeletal perturbations compared to control conditions (Fig. 2A). Cortactin staining in the different growth cone areas was quantified after cytochalasin B (n = 31 growth cones; see text for details) or nocodazole (n = 49) treatment and was normalized against cortactin staining of growth cones treated with DMSO only (D and H; n = 45). Histograms represent means ± SEM. Lines at the value 1 on the y axis indicate the level of staining in control DMSO-treated cells. MT: microtubule. Bars = 10 μm.

