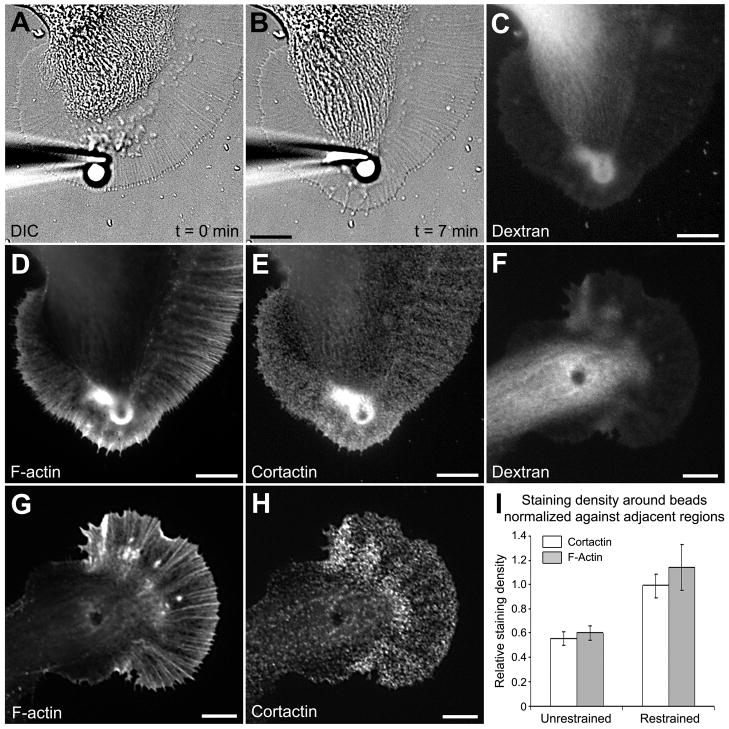
Figure 5. Cortactin accumulates in the vicinity of apCAM beads.
A: DIC image of a growth cone right after apCAM-bead placement. Growth cone guidance was induced by placing beads in the P domain and preventing them from undergoing retrograde movements by restraining them with glass pipettes. B: After a latency period of 5 min, the C domain advanced towards the beads, while leading edge protrusion occurred in front of the beads. C: A Growth cone shown in B was fixed at the end of C domain extension and Texas Red-dextran image was acquired to assess the volume distribution of subcellular regions. F-actin (D) and cortactin (E) labeling of the growth cone shown in B revealed an increase of both signals. Dextran (F), F-actin (G), and cortactin (H) images of unrestrained beads that were coupled to retrograde actin flow and generally localized in the T zone or the C domain during fixation. I: F-actin and cortactin stainings were quantified around the beads and in adjacent areas, and then normalized against the dextran signal (volume). Then, volume-corrected signals around the beads were divided by the respective volume-corrected signal in adjacent regions for both unrestrained (n = 11 growth cones) and restrained (n = 9) beads. Histograms represent means ± SEM. The value 1 on the y axis refers to the actin or cortactin staining density in the growth cone P domain in the absence of beads. Bars = 10 μm.

