
Fig. 5.
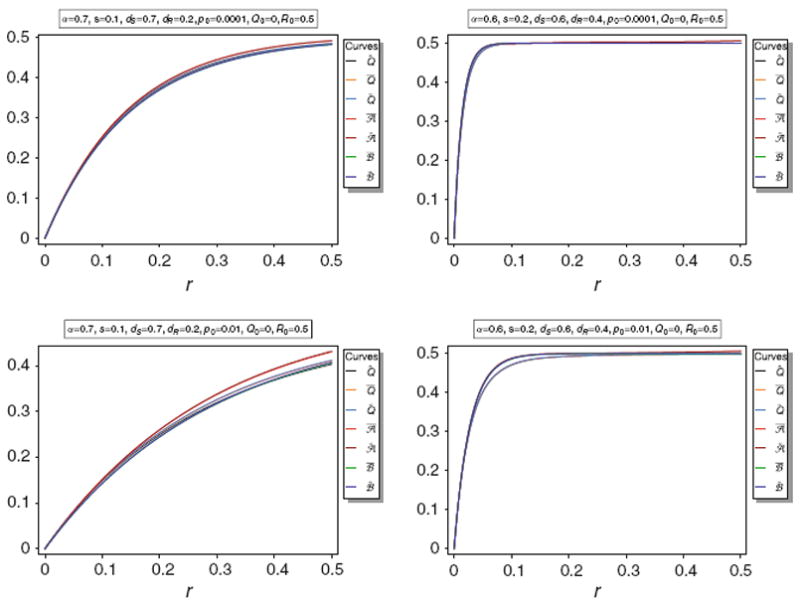
Equilibrium frequency Q̂ of the neutral allele N1 and various bounds of Q̂ as a function of r for different parameter combinations. The panels show Q̂ along with its upper bounds Q̅ and Q̃, as well as the approximations A̅, Ã, B̅, B̃. The parameters are the same as in Fig. 3