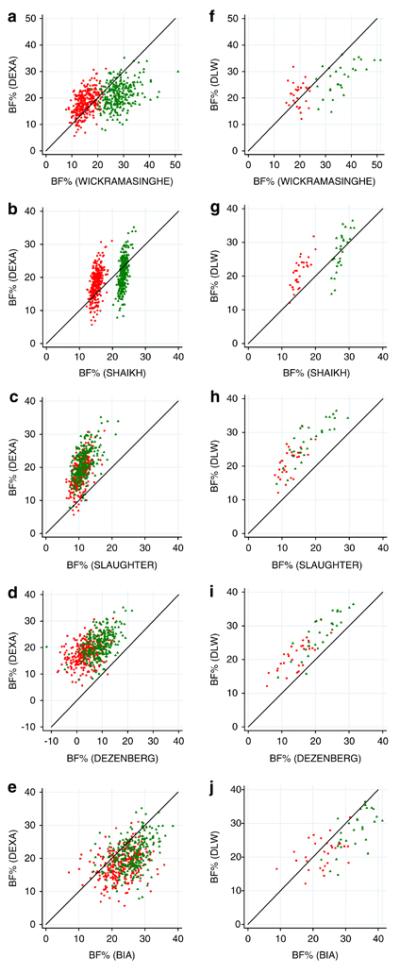
Figure 1.

Scatterplots of body fat percentage calculated using published equations against that from a reference method. ‘BF% Wickramasinghe’,’BF% Shaikh’, BF% Slaughter, ‘BF% Dezenberg’ refer to body fat percentage calculated using the respective published equation; ‘BF% DXA’, body fat percentage derived from dual-energy X-ray absorptiometry scan; ‘BF% DLW’, body fat percentage derived from 18O dilution administered as doubly labelled water. Figures a-e relate to data from Pune (n=570), figures f-j relate to data from Mysore (n=58).
 Male
Male  Female
