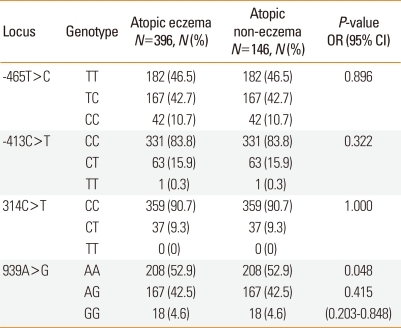
Table 3.
Genotype and allele frequencies of histamine N-methyltransferase (HNMT) polymorphisms in children with atopy
P values were calculated using dominant models. Values in bold indicate statistical significance. For multiple comparisons of genotype and allele frequencies, Bonferroni's multiple adjustment was applied to the level of significance, which was set at P<0.0125 (0.05/4). Logistic regression analysis was applied to control for age and gender as covariables.
N, number of patients.

