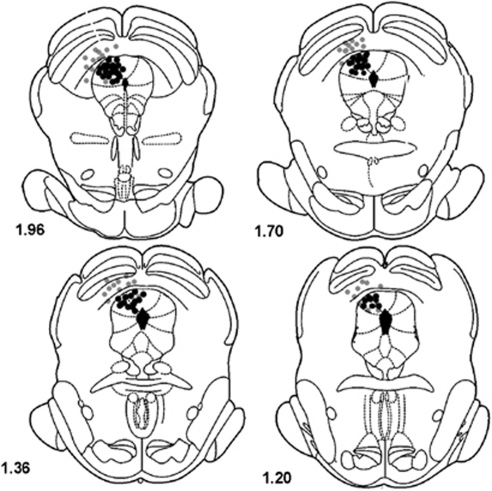
Figure 1.
Schematic representation of coronal sections from interaural line of the rat brain (Paxions and Watson, 1997) showing the injection/electrical stimulation sites inside (dark circles) of the dPAG. Sites where electrical stimulation failed to induce escape responses are also presented (gray circles). Due to overlaps, the number of points represented is fewer than the number of rats actually employed in the experiments.

