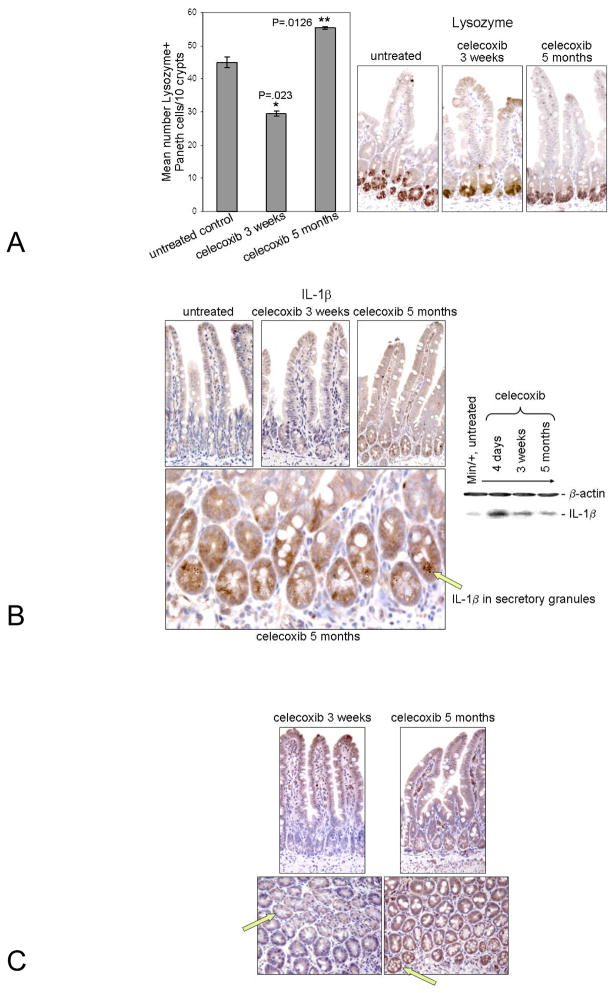
Figure 4. Paneth cell number and IL-1β and COX-2 expression were modulated by the duration of celecoxib treatment.
Representative photomicrographs of sectioned ileum from Min/+ mice untreated or treated for indicated times are shown that were immunostained for Lysozyme (Right). A graph of the mean number of Paneth cells/10 crypt length of ileum vs. the duration of treatment time is shown (Left) (A). Representative photomicrographs of ileum from Min/+ mice untreated or treated for indicated times are shown that were immunostained for IL- 1β (Top, Left). Below is a 40X magnification image of ileum from Min/+ treated with celecoxib for 5 months; an arrow points to IL-1β in the secretory granules of Paneth cells (Bottom, Right). IB analysis of IL-1β expression in lysates of ileum from Min/+ mice untreated or treated for indicated times is shown (Left) (B). Representative photomicrographs of ileum from Min/+ mice untreated or treated for indicated times are shown that were immunostained for COX-2 is shown; arrows indicate COX-2 expression, or the lack of its expression, in Paneth cells (C).

