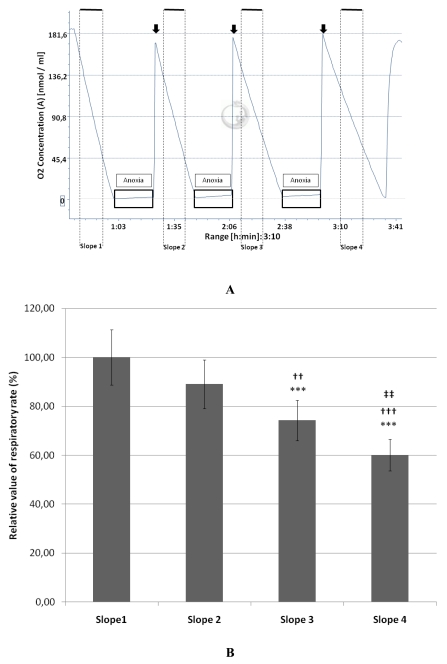
Fig. (1).
A: Typical example of a complete protocol of three anoxia / reoxygenation cycles of equine endothelial (107) cells monitored by oxygraphy. The black boxes represent the periods of anoxia and the arrows indicate the re-oxygenation steps.
B: Decrease of the relative value (mean ± SD; n=10) of the respiratory rate measured on cultured endothelial (107) cells after each cycle of anoxia/reoxygenation (slopes 2, 3 and 4). The mean value measured for the slope 1 (before anoxia) was taken as 100% (n=10).
***P<0.001 versus the slope 1.
††P<0.01 and †††P<0.001 versus the slope 2.
‡‡P<0.01 versus slope 3.

