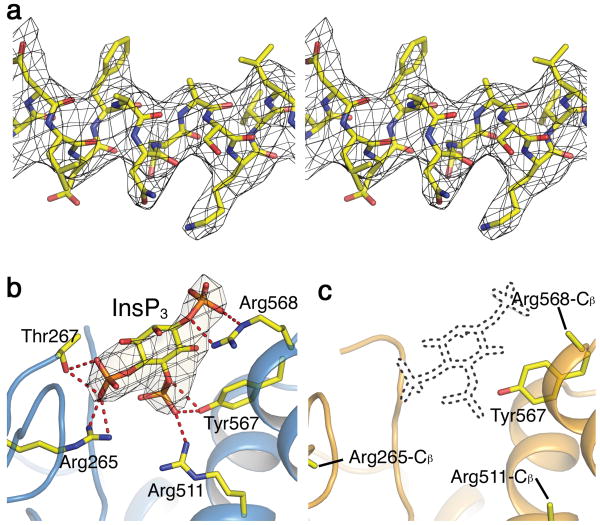
Figure 2.
Structures and electron density maps of regions within LDB. (a) Stereo view of a section (Asp442-Leu453) of helix α4 in the InsP3-bound structure, superimposed on the corresponding 2Fo-Fc map contoured at 1 σ. (b, c) Structures of the InsP3-binding site in LBD bound (b) or unbound (c) with InsP3, superimposed on the respective Fo-Fc InsP3-omit maps contoured at 4 σ. The InsP3 molecule in panel b is shown as a stick model; the corresponding site in c is delineated by dots. The InsP3-interacting side-chains, shown as sticks in b, are mostly disordered in c. The red dotted lines in b indicate potential hydrogen bonds.

