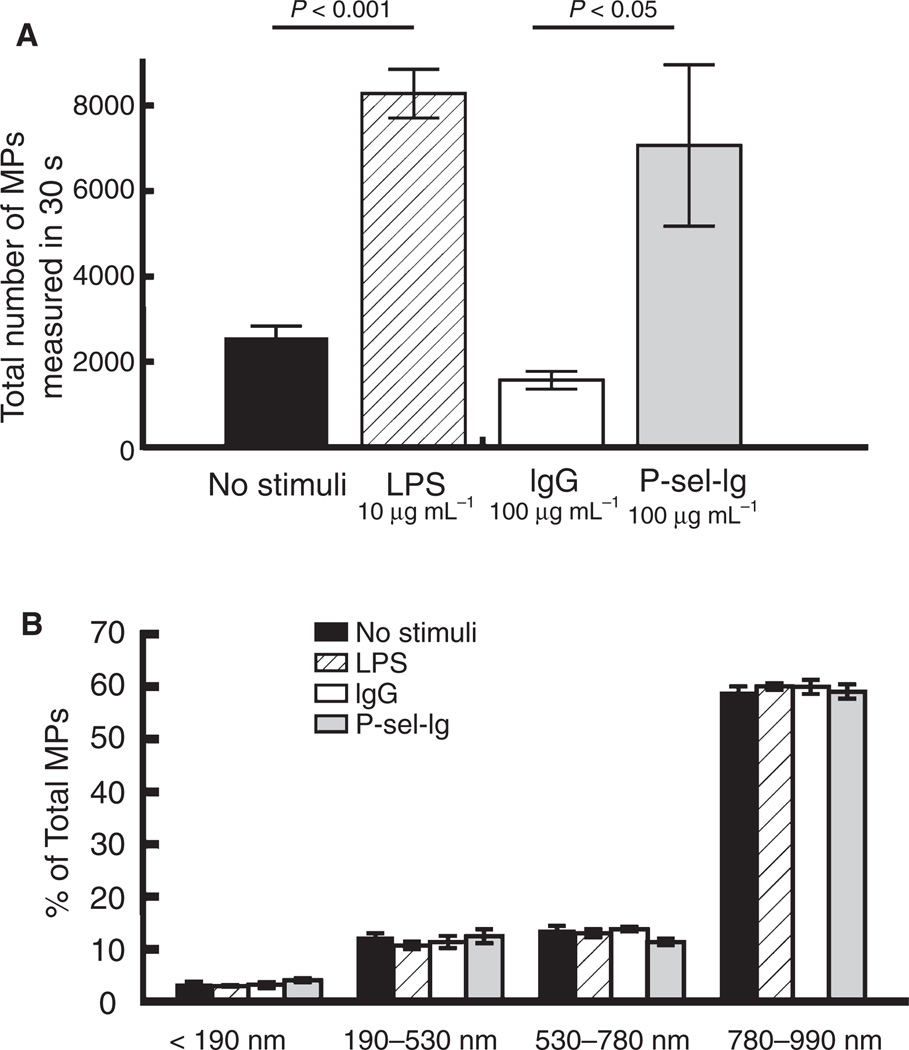
Fig. 1.
Microparticle (MP) number and size distribution. MP numbers and size distribution were measured by flow cytometry. Data represent mean ± standard error of the mean. (A) Lipopolysaccharide (LPS) and P-selectin-Ig chimera (P-sel-Ig) stimulations (6 h) produced three-fold to four-fold more MPs than controls (6 h) (n = 6–7). (B) The size distribution of calcein-positive MPs was similar in all four populations, using forward scatter (FSC)-A gates defined by size-calibrated polystyrene beads (n = 6).

