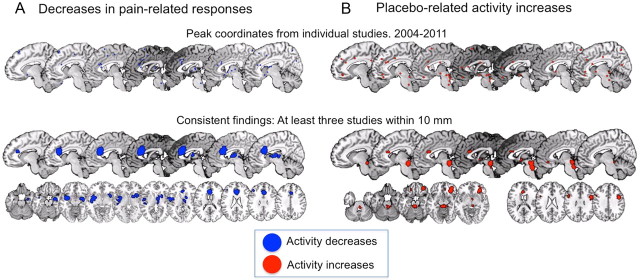
Figure 2.
Consistent placebo-related neuroimaging findings from 2004 to 2011. A complete list of studies can be found in Wager and Fields (2011). A, Placebo-related decreases during pain, or regions in which placebo-related decreases were correlated with placebo analgesia. B, Placebo-related increases in neuroimaging activity during anticipation or pain, or regions in which placebo-related increases correlated with placebo analgesia. The top rows show individual peak coordinates (for more details, see Wager and Fields, 2011), and the bottom rows show areas activated in at least three separate maps. Note that increases and decreases can be found in the same brain regions, if, e.g., there are consistent increases during anticipation of pain and decreases during pain experience. This is the case with the rostral dorsal cingulate region shown in both maps.

