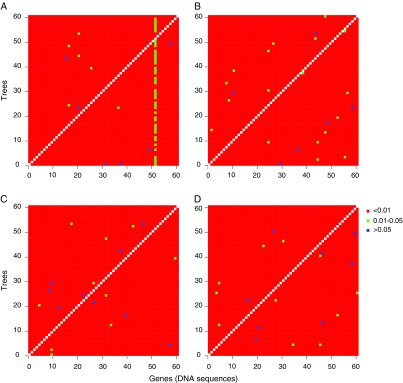
FIG. 2.—
Heatmap of AU test, P values obtained by comparing universally present virulence gene trees based on nucleotide sequences. The AU test was performed on the original 61 universally present virulence genes (A) and also performed on 61 artificially constructed “super-genes” by randomly concatenating 3 (B), 6 (C), or 9 (D) universally present virulence genes. In each panel, there are 1,830 tested gene pairs and 3,660 P values. The 52nd gene in panel A is pilN, which has the least nucleotide diversity (supplementary fig. S2, Supplementary Material online) among the 61 virulence genes.

