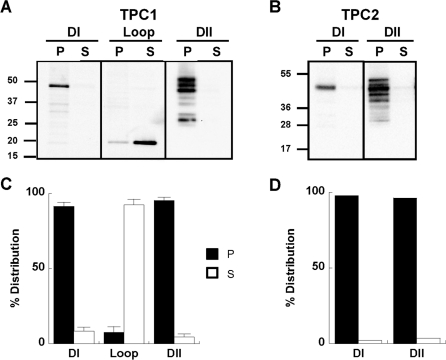
Figure 2. Membrane insertion of TPC domains.
(A and B) Western blot analysis, using an anti-Myc antibody, of pellet (P) and supernatant (S) fractions prepared from cells expressing the indicated region of TPC1 (A) and TPC2 (B). The molecular mass in kDa is indicated on the left-hand side. Summary data quantifying the distribution of the expressed protein is shown in (C) (n>3) and (D) (n=2). DI, domain I; DII, domain II.

