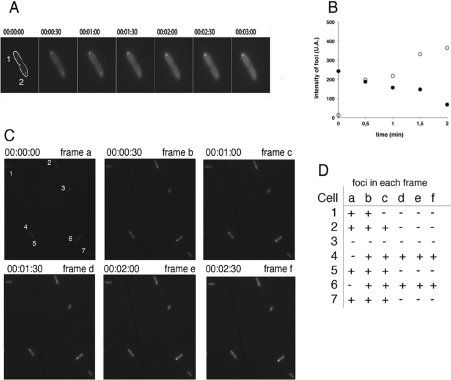
Figure 4. Time-lapse microscopy of GFP foci.
(A) Seven time-lapse images of cells carrying pRW904 were collected 30 s apart, showing the appearance and disappearance of foci in two cells (denoted cell 1 and cell 2) shortly after division. (B) Time course of intensity profiles of GFP foci in cell 1 (○) and cell 2 (●). (C) Fluorescence time-lapse micrographs of E. coli carrying pRW904 collected 30 s apart. (D) Formation and de-formation of foci in individual cells from (C). The presence or absence of foci in individual cells is denoted by + and by − respectively.

