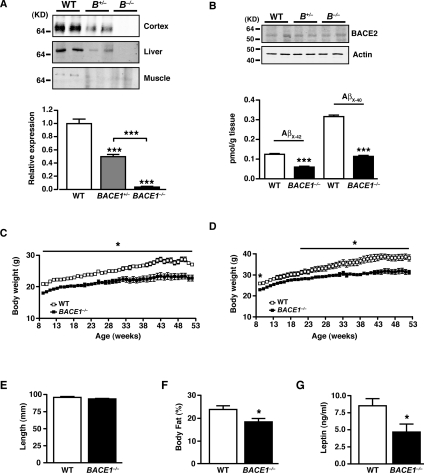
Figure 1. BACE1−/− mice exhibit reduced adiposity.
(A) BACE1 protein levels in BACE1−/−, BACE1+/− and WT mice, as shown by representative immunoblots of mouse cerebral cortex, skeletal muscle and liver. The histogram (bottom panel) shows mean normalized levels of BACE1 in cortex from WT, BACE1+/− and BACE1−/− mice following 20 weeks fed on the regular chow diet. WT, n=11; BACE1+/−, n=11; BACE1−/−, n=12. (B) Representative immunoblots of BACE2 in WT, BACE1+/− and BACE1−/− mouse cerebral cortices. The histogram (bottom panel) shows levels of Aβx-42 and Aβx-40 in the cerebral cortex of WT and BACE1−/− mice. WT, n=5; BACE1−/−, n=6. Molecular mass is given in kDa on the left-hand side. Male (C) and female (D) body mass curves of age-matched WT littermate and BACE1−/− mice fed on a regular chow diet, monitored over a period of 45 weeks from 9 weeks of age. The results in (C) and (D) are means±S.E.M. from 9–12 animals of each genotype. (E) Male BACE1−/− mice have unaltered body length compared with the WT controls. WT, n=20; BACE1−/−, n=19. (F) Percentage body fat determined by qMR imaging in 8-month-old male WT and BACE1−/− mice. WT, n=5; BACE1−/−, n=7. (G) Fasting blood leptin levels in 8-month-old male mice of the indicated genotypes. WT, n=12; BACE1−/−, n=15. Results are means± S.E.M. *P<0.05; **P<0.01; ***P<0.001.

