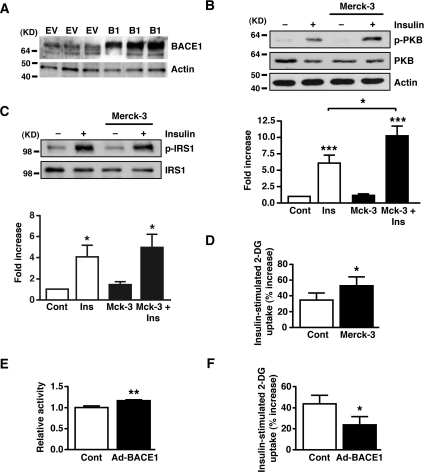
Figure 7. Inhibition of BACE1 increases insulin signalling in C2C12 muscle cells.
(A) Representative immunoblots showing the presence of BACE1 protein in the mouse C2C12 skeletal muscle cell line under control conditions (EV) and following transfection with adenovirus containing Myc-His-tagged BACE1 (B1). (B–D) Mouse C2C12 muscle cells were exposed to the BACE1 inhibitor Merck-3 for 24 h, prior to cells being stimulated with saline or insulin for 30 min. (B) Representative immunoblots of insulin-stimulated phosphorylation of PKB at Ser473 in treated and untreated C2C12 cells. The histograms show the normalized means±S.E.M. of the immunoblots (n=10). (C) Representative immunoblots of IRS-1 and phosphorylated IRS-1 at Tyr612 in treated and untreated C2C12 skeletal muscle cells. The histograms show the normalized means±S.E.M. of the immunoblots (n=8). Molecular mass is given in kDa on the left-hand side. (D) Insulin-stimulated 2-deoxyglucose uptake in treated and untreated C2C12 cells, expressed relative to the uptake in the absence of insulin (n=11). (E) Relative BACE1 activity in C2C12 cells transfected with empty vector (Cont) or Myc-His-tagged BACE1 (n=9). (F) Insulin-stimulated 2-deoxyglucose uptake in C2C12 cells, transfected with empty vector (Cont) or Myc-His-tagged BACE1, expressed relative to uptake in the absence of insulin (n=5). *P<0.05; **P<0.01; ***P<0.001.

