
Fig 2.
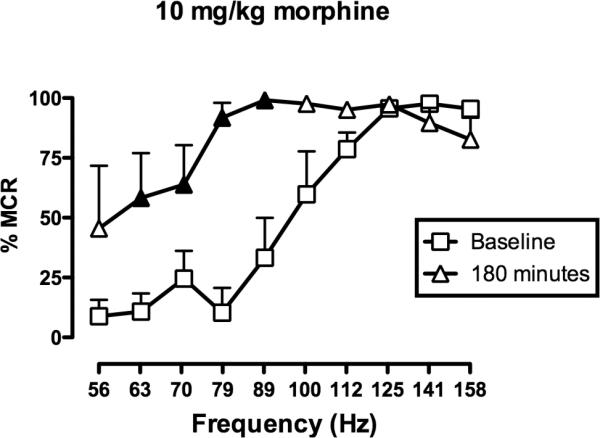
10 mg/kg morphine facilitated ICSS after 180 minutes. Horizonal axis: Frequency of electrical brain stimulation in hertz (log scale). Vertical axis: ICSS rate expressed as percent maximum control rate (%MCR). Filled symbols indicate frequencies at which ICSS rates were significantly higher than baseline as determined by the Holm-Sidak post hoc test following a significant analysis of variance (p<0.05). ANOVA revealed a significant main effect of frequency [F(9,18)=17.3; p<0.001], no significant effect of treatment [F(1,2)=9.9; p=0.09], but a significant frequency×treatment interaction [F(9,18)=4.0; p<0.01]. All points show mean data for 3 rats, and error bars are omitted for clarity.