
Figure 5.
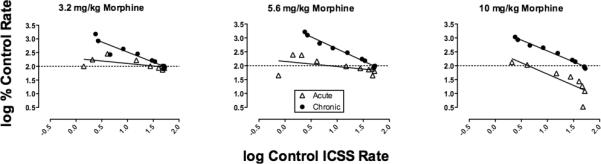
Rate dependency of morphine effects on ICSS. Horizonal axes: Log control ICSS rate (in units of stimulations/frequency trial) at each of the 10 frequencies of brain stimulation. Vertical axes: Log percent control ICSS rate observed 30 min after morphine treatment. Panels show effects of 3.2, 5.6 and 10 mg/kg morphine during the acute dosing phase of the study, and after the 7th daily dose during the chronic dosing phase of the study. All points show mean data for 5-6 rats.